Stamford Hail, Wind & Storm Damage Roof Statistics (10-Year NOAA Report)
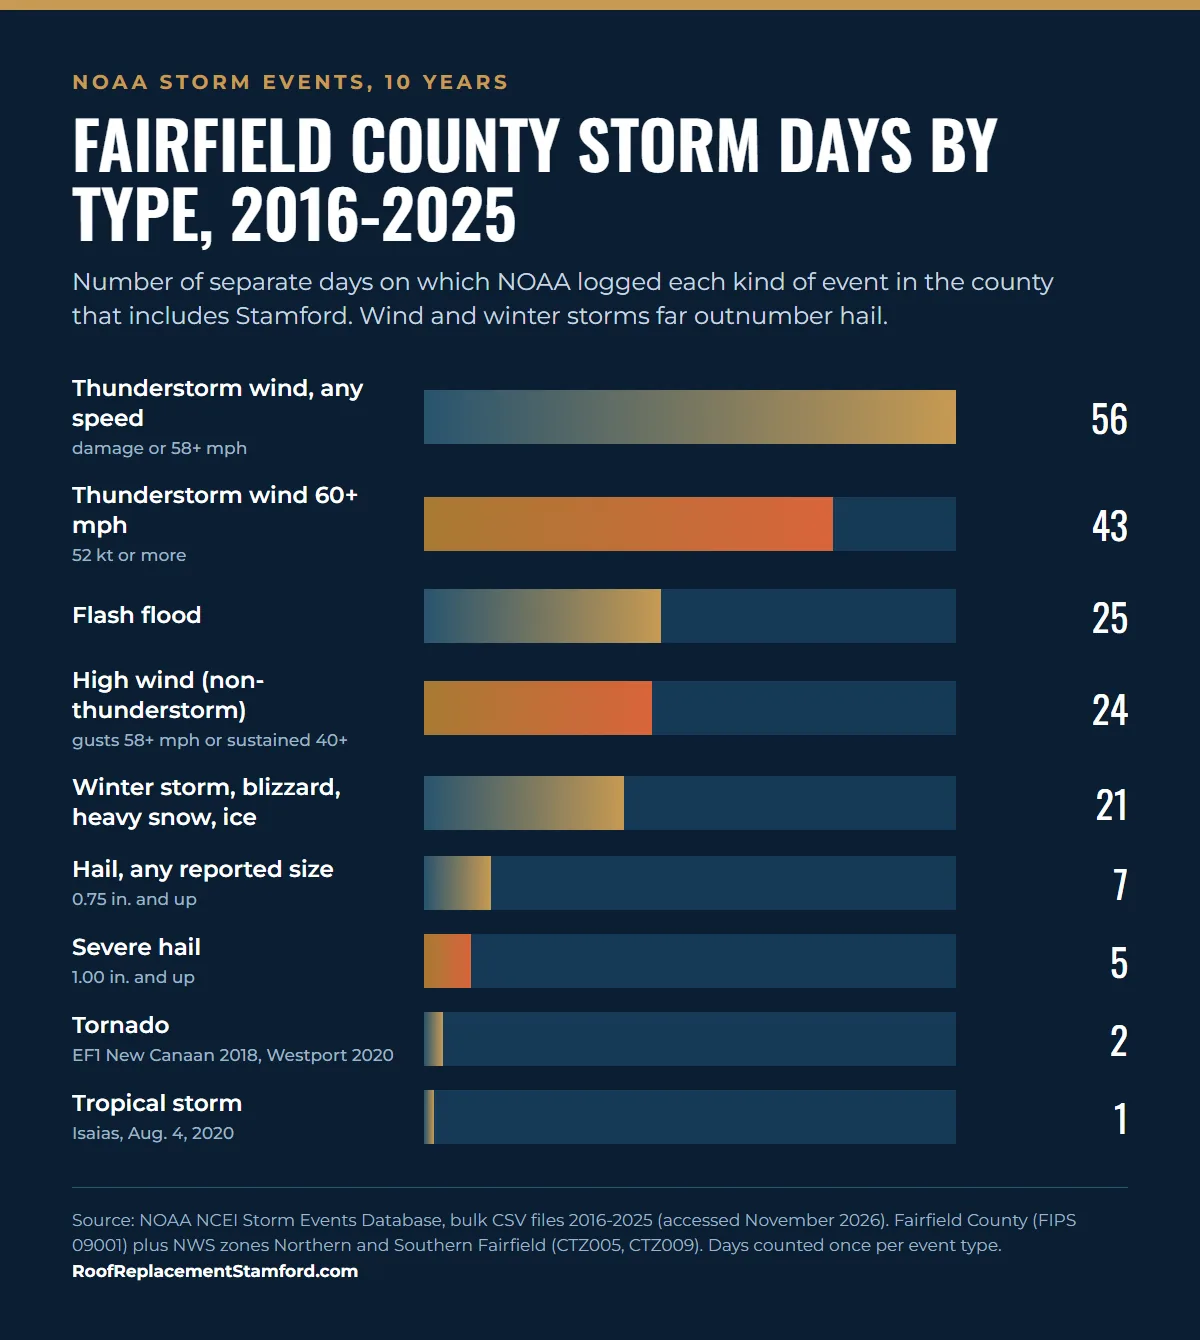
Hail gets the headlines, but it is not what damages most Stamford roofs. From 2016 through 2025 the NOAA Storm Events Database logged just 5 reports of severe hail (1 inch or larger) in all of Fairfield County, none of them in Stamford. Over the same ten years it logged 129 thunderstorm wind reports of 60 mph or more on 43 different days, 24 days of non-thunderstorm high wind, 21 days of major snow or ice and one tropical storm, Isaias, that NOAA tied to $18 million in county property damage. This report counts every one of those events from NOAA's own files, lists the dates, and pulls out the measured gusts in Stamford that homeowners and adjusters can match to a date of loss.
- NOAA logged 416 storm event entries for Fairfield County and its two forecast zones from 2016 through 2025 (NOAA Storm Events data).
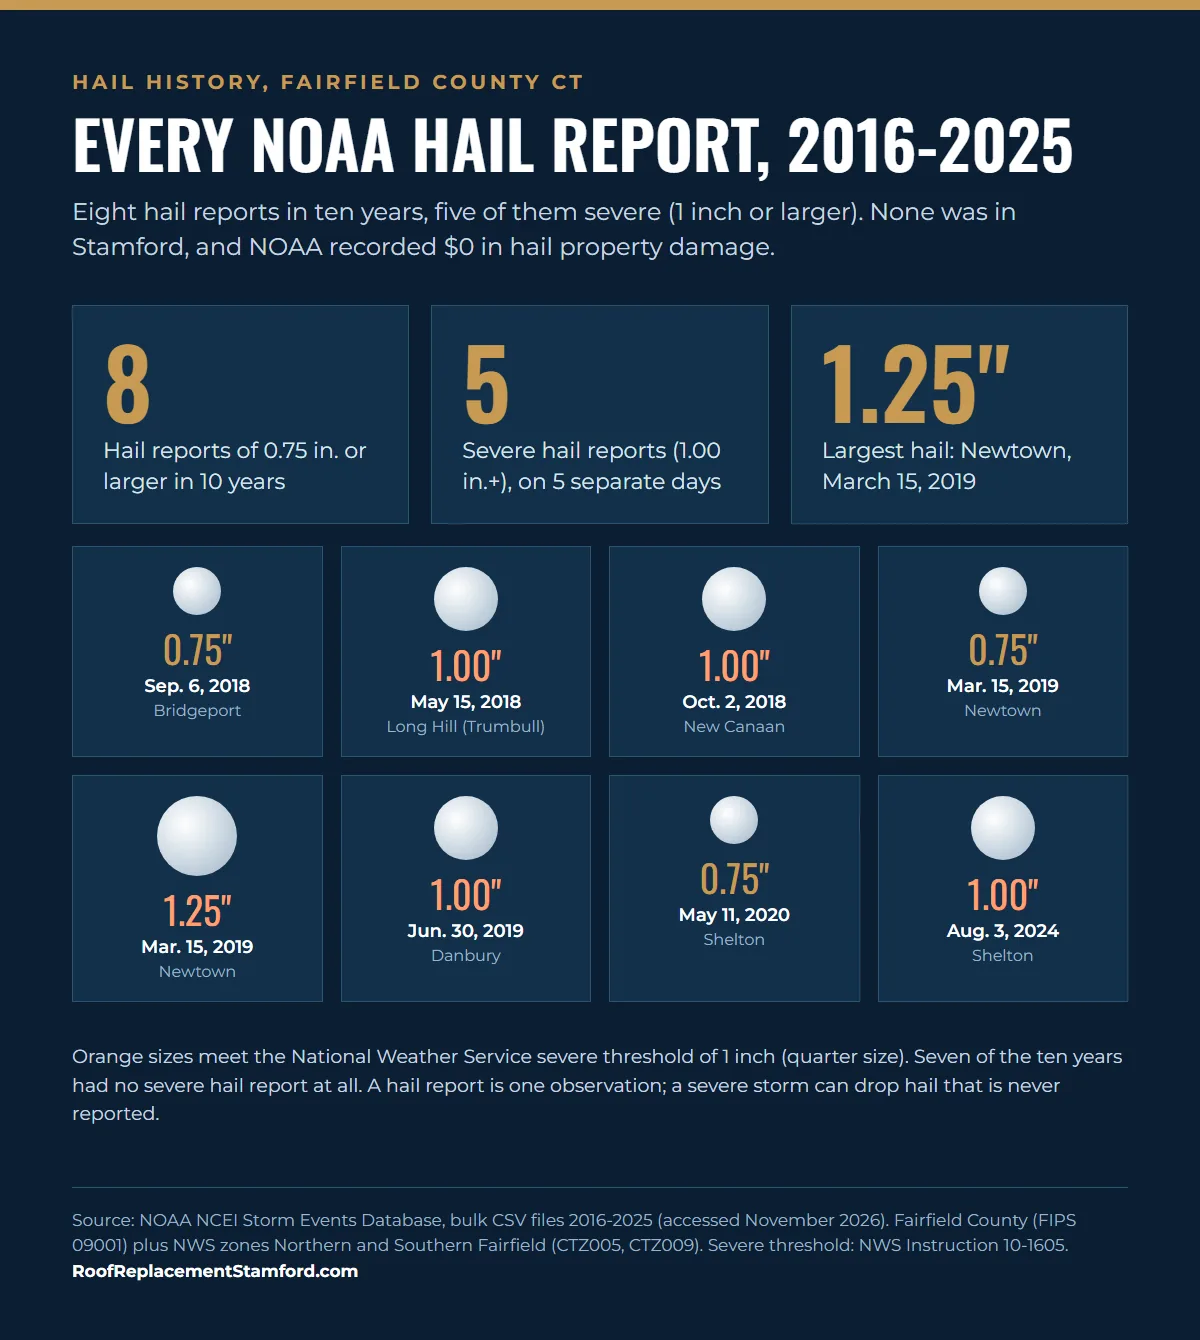
- Only 8 hail reports of 0.75 inch or larger were filed in the county in ten years, 5 of them severe; the largest was 1.25 inches in Newtown on March 15, 2019 (NOAA).
- Seven of the ten years had no severe hail report at all, and NOAA recorded $0 in hail property damage (NOAA).
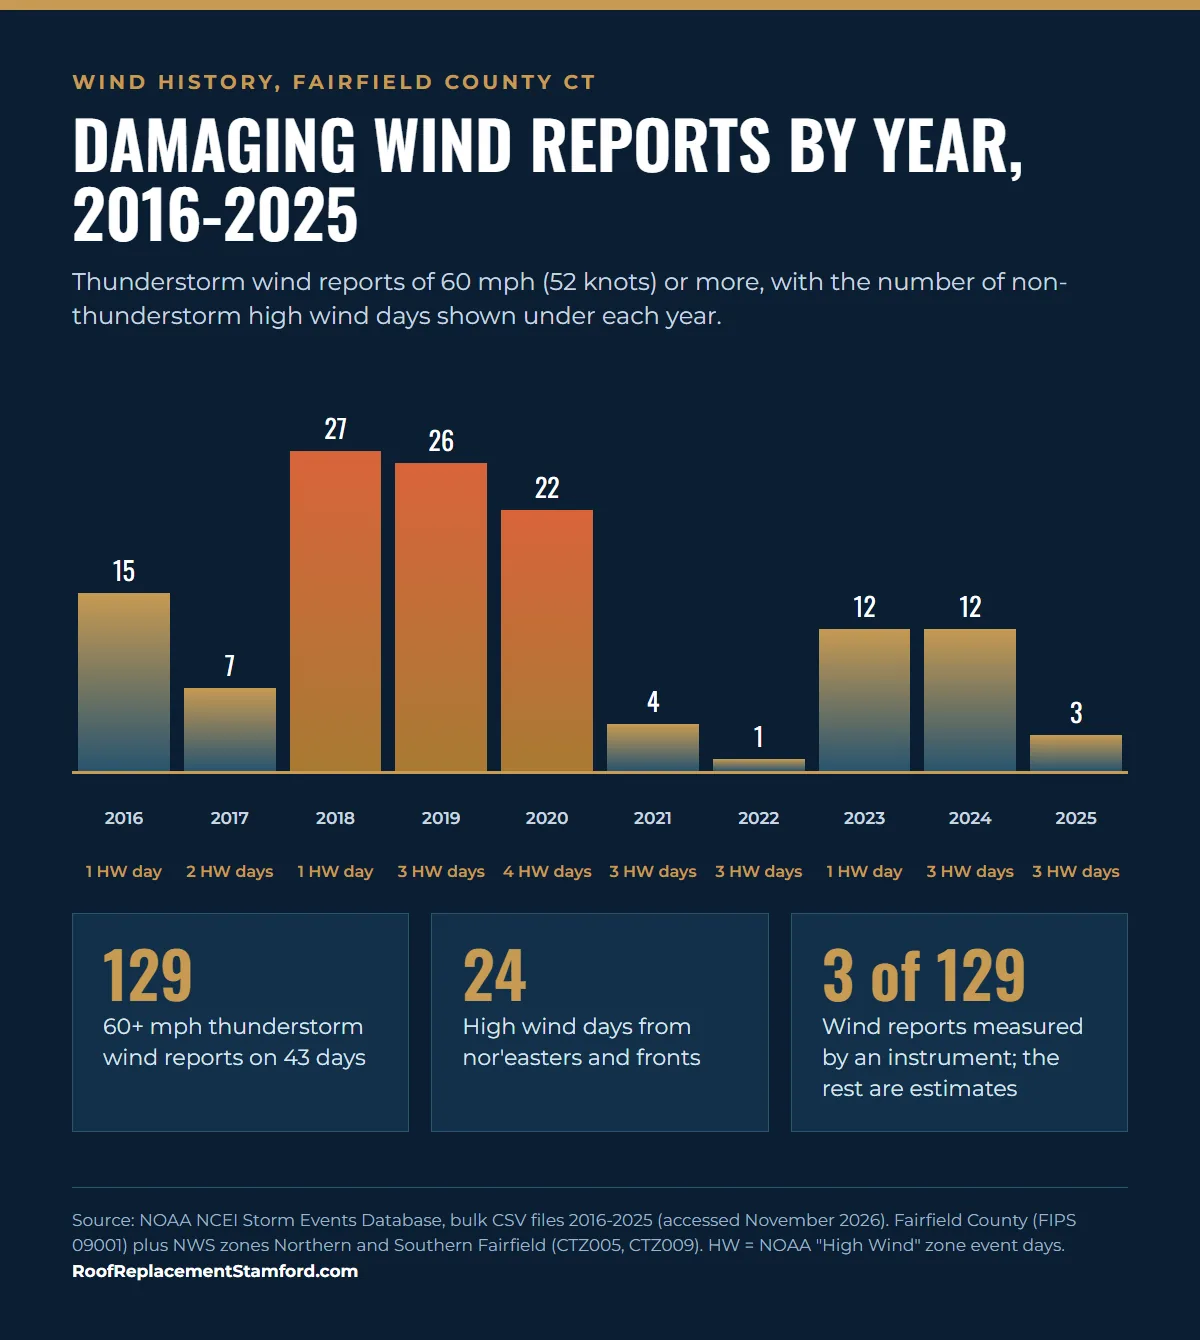
- Thunderstorm wind of 60 mph or more was reported 129 times on 43 days; 2018, 2019 and 2020 were the worst years, with 27, 26 and 22 reports (NOAA).
- Only 3 of those 129 wind reports were measured by an instrument; the rest are estimates, mostly from downed trees (NOAA).
- Nor'easters and strong fronts produced High Wind events on 24 days; Stamford stations measured gusts of 67 mph (Nov. 15, 2020), 66 mph (Dec. 18, 2023) and 65 mph (Oct. 30, 2017) (NOAA).
- Tropical Storm Isaias on August 4, 2020 brought gusts to 70 mph at Norwalk, 752,225 Connecticut outages at peak and $18 million in NOAA-estimated county property damage (NOAA).
- A May 15, 2018 macroburst near Brookfield had winds estimated at 100 to 110 mph and led to federal disaster declaration DR-4385 for Fairfield County (FEMA).
- Blizzards, winter storms, heavy snow and ice were logged on 21 days, including 3 blizzard days (NOAA).
- NOAA still files Connecticut storms under the old counties and NWS zones, even though the Census Bureau switched to nine planning regions in 2022 (Federal Register).
- 16 billion-dollar weather disasters affected Connecticut from 2016 through 2024, out of 45 since 1980 (NOAA NCEI).
- Roofs in moderate-to-poor condition show about 60% higher loss costs than roofs in good or excellent condition (Verisk).
- 18% of Northeast residential roofs are 31 years or older, the highest share of any region (Verisk).
- Aging alone can cut the lifespan of some roofing products to 10 to 15 years, according to an IBHS field study (IBHS).
1. How We Counted NOAA Storm Events for Stamford
The NOAA National Centers for Environmental Information (NCEI) Storm Events Database is the official record of U.S. severe weather, compiled by National Weather Service offices under NWS Instruction 10-1605. We downloaded NOAA's yearly bulk event files for 2016 through 2025 (plus 2026 to date) in November 2026 and filtered every Connecticut record to Stamford's area.
NOAA does not file events by city. It uses two kinds of area, and Stamford sits in both of these:
| NOAA area used in this report | Code | Event types filed there | Source |
|---|---|---|---|
| Fairfield County | County 09001 | Hail, thunderstorm wind, tornado, flash flood, lightning | NWSI 10-1605 |
| Southern Fairfield (includes Stamford) | Zone CTZ009 | High wind, strong wind, winter storm, blizzard, heavy snow, tropical storm, coastal flood | NWSI 10-1605 |
| Northern Fairfield | Zone CTZ005 | Same zone-based types for the inland half of the county | NWSI 10-1605 |
| Threshold used | Value | Source |
|---|---|---|
| Severe hail (NWS definition) | 1.00 inch diameter or larger | National Weather Service |
| Smallest hail NOAA enters in Storm Data | 0.75 inch | NWSI 10-1605 |
| Severe thunderstorm wind (NWS definition) | 58 mph (50 knots) or more | National Weather Service |
| Wind filter used in this report | 52 knots (60 mph) or more | NOAA magnitude field, in knots |
| High Wind event (non-thunderstorm) | Sustained 40 mph for 1 hour, or gusts of 58 mph or more | NWSI 10-1605 |
| Date range | Jan. 1, 2016 to Dec. 31, 2025 (2026 data through early July shown separately) | NOAA bulk files |
The planning-region question. In 2022 the Census Bureau adopted Connecticut's nine planning regions as county-equivalents, replacing the eight counties, which ceased to function as governments in 1960. Stamford now falls in the Western Connecticut planning region for Census data. NOAA did not follow: every Connecticut event in its files from 2016 through July 2026 is still filed under the old counties (Fairfield is county 09001) or under NWS forecast zones. So "Fairfield County" remains the right search term in the Storm Events Database, and the ten-year series below is consistent from start to finish.
One caution applies throughout: a NOAA entry is a report, not a measurement of everything that happened. A severe storm can drop hail on a neighborhood that no one reports, and one thunderstorm line can generate a dozen wind reports. That is why the tables below show both the number of reports and the number of separate days.
2. Year-by-Year Storm Table: Fairfield County, 2016-2025
This is the core table of the report. Every number is a count of NOAA Storm Events entries for Fairfield County (hail and thunderstorm wind) or the Northern and Southern Fairfield forecast zones (high wind, snow and ice, tropical storms). Thunderstorm wind shows reports with the number of separate days in brackets; the other columns count days.
| Year | Severe hail reports (1 in.+) | All hail reports (0.75 in.+) | Thunderstorm wind 60+ mph: reports (days) | High wind days | Snow and ice storm days | Tropical storm days | All NOAA entries |
|---|---|---|---|---|---|---|---|
| 2016 | 0 | 0 | 15 (6) | 1 | 2 | 0 | 32 |
| 2017 | 0 | 0 | 7 (4) | 2 | 2 | 0 | 27 |
| 2018 | 2 | 3 | 27 (5) | 1 | 6 | 0 | 80 |
| 2019 | 2 | 3 | 26 (8) | 3 | 2 | 0 | 55 |
| 2020 | 0 | 1 | 22 (6) | 4 | 1 | 1 | 43 |
| 2021 | 0 | 0 | 4 (4) | 3 | 2 | 0 | 32 |
| 2022 | 0 | 0 | 1 (1) | 3 | 2 | 0 | 21 |
| 2023 | 0 | 0 | 12 (4) | 1 | 1 | 0 | 44 |
| 2024 | 1 | 1 | 12 (4) | 3 | 1 | 0 | 57 |
| 2025 | 0 | 0 | 3 (1) | 3 | 2 | 0 | 25 |
| 10-year total | 5 | 8 | 129 (43) | 24 | 21 | 1 | 416 |
Source: NOAA NCEI Storm Events Database bulk files, 2016-2025, accessed November 2026. Snow and ice = Winter Storm, Blizzard, Heavy Snow and Ice Storm events. "All NOAA entries" also includes flash floods, coastal floods, strong wind, winter weather advisories, heat and lightning.
The busiest years were 2018, 2019 and 2020, which together account for 75 of the 129 damaging thunderstorm wind reports. 2018 also had six snow and ice storm days, including two March nor'easters a week apart. The quietest year for wind was 2022, with a single 60 mph thunderstorm report. The high totals for 2018, 2023 and 2024 are partly flash flooding (20, 22 and 19 entries), which matters for basements and roads more than roofs.
3. Stamford Hail History: Every Report Since 2016
Here is the complete list. NOAA enters every hail report of 0.75 inch or more, and only eight were filed anywhere in Fairfield County in ten years. None was located in Stamford, Greenwich, Darien or Norwalk; all but one came from inland towns.
| Date | Location (NOAA) | Hail size | Severe? | Property damage recorded |
|---|---|---|---|---|
| May 15, 2018 | Long Hill (Trumbull) | 1.00 in. (quarter) | Yes | $0 |
| Sep. 6, 2018 | Bridgeport | 0.75 in. | No | $0 |
| Oct. 2, 2018 | New Canaan | 1.00 in. | Yes | $0 |
| Mar. 15, 2019 | Newtown | 1.25 in. (half dollar) | Yes | $0 |
| Mar. 15, 2019 | Newtown | 0.75 in. | No | $0 |
| Jun. 30, 2019 | Danbury | 1.00 in. | Yes | $0 |
| May 11, 2020 | Shelton | 0.75 in. | No | $0 |
| Aug. 3, 2024 | Shelton | 1.00 in. (quarter) | Yes | $0 |
Source: NOAA NCEI Storm Events Database, Fairfield County Hail events, 2016-2025. One more report has been filed since: 1.00-inch hail in Sherman on June 11, 2026.
| Hail context | Value | Source |
|---|---|---|
| Hail size Verisk treats as severe, and the dominant weather threat to roofs across much of the U.S. | 1 inch or larger | Verisk |
| States where severe hail hit more than 20% of roofs in 2025 | 16 (up from 12 in 2024) | Verisk |
| Top states by share of roofs hit by severe hail, 2025 | AR, KS, NE, OK, SD | Verisk |
| Hail damage roof repair, U.S. typical cost (2026) | $700 to $4,000 | Angi |
The honest reading is that Stamford is not hail country. Five severe reports in ten years, spread across five towns, with no recorded damage, is a very different picture from the Plains states where Verisk finds hail hitting a fifth of all roofs in a year. That does not mean hail never damages a roof here; unreported hail is common, and a single storm can matter. But if someone knocks on your door after a summer thunderstorm offering a free "hail inspection," check the NOAA record for that date first. Our Stamford roofer workforce report covers how to verify a contractor's Connecticut registration.
4. Thunderstorm Wind: The Most Frequent Roof Threat
Thunderstorm wind is the event NOAA logs most often in Fairfield County: 158 reports on 56 days from 2016 to 2025, of which 129 reports on 43 days were 52 knots (60 mph) or stronger. Most reports come from downed trees and wires, and NOAA assigns an estimated speed based on the damage.
| Thunderstorm wind statistic (2016-2025) | Value | Source |
|---|---|---|
| All thunderstorm wind reports / days | 158 / 56 | NOAA |
| Reports of 60 mph or more / days | 129 / 43 | NOAA |
| Reports of 69 mph or more | 43 | NOAA |
| Reports measured by an instrument | 3 (53-54 knots) | NOAA |
| Strongest: macroburst near Brookfield, May 15, 2018 | 100 to 110 mph, about 2.5 miles wide and 5 miles long | NOAA event narrative |
| Property damage NOAA attributed to thunderstorm wind | $635,000 | NOAA |
| Stamford thunderstorm wind reports (NOAA locations) | Feb. 25, 2016 (Shippan Point); Aug. 13, 2016; Jun. 30, 2019 (Glenbrook); Jul. 6, 2019 (North Stamford); Aug. 3, 2020 (Springdale); Jun. 6, 2026 | NOAA |
Because almost every speed is an estimate from fallen trees, these numbers say more about how often damaging wind arrives than about exact speeds over any one roof. For a homeowner, the practical signal is the same: tree limbs and wind are what lift shingles, crack ridge caps and open flashing in this county. If a storm on one of these dates left shingles in the yard, our storm damage roof repair page explains what to document before anything is fixed.
5. High Wind, Nor'easters and Measured Gusts in Stamford
Thunderstorms are not the only source of roof-damaging wind. NOAA files non-thunderstorm wind from nor'easters, coastal lows and strong cold fronts as "High Wind" when gusts reach 58 mph or sustained winds reach 40 mph for an hour. These events cover a whole forecast zone at once and often last for hours, which is why they matter so much to roofs along the Stamford shoreline.
| Non-thunderstorm wind (2016-2025) | Value | Source |
|---|---|---|
| High Wind days, Northern and Southern Fairfield zones | 24 (28 zone entries) | NOAA |
| Strong Wind days (damaging gusts under 58 mph) | 19 | NOAA |
| Property damage NOAA attributed to High Wind / Strong Wind | $1.06 million / $780,000 | NOAA |
| Highest gust in a Fairfield County High Wind narrative | 71 mph, Greenwich, Dec. 24, 2020 | NOAA |
| Gust at Greens Ledge Light off Rowayton, Dec. 19, 2025 | 70 mph | NOAA |
| Months with the most High Wind days | October to April (23 of 24 days) | NOAA |
The gusts below were measured at stations in or next to Stamford and are quoted in NOAA's event narratives. For anyone filing or reviewing a wind claim, these are the dates with instrument readings closest to Stamford roofs.
| Date | Peak gust | Where measured | NOAA event |
|---|---|---|---|
| Nov. 15, 2020 | 67 mph | Stamford | High Wind, Southern Fairfield |
| Dec. 18, 2023 | 66 mph | Stamford mesonet station | High Wind, Southern Fairfield |
| Oct. 30, 2017 | 65 mph | Stamford (64 mph at a second Stamford station on Oct. 29) | High Wind, Southern Fairfield |
| Nov. 30, 2020 | 63 mph | Stamford mesonet station | High Wind, Southern Fairfield |
| Jan. 9, 2024 | 60 mph | Stamford | High Wind, Southern Fairfield |
| Nov. 1, 2019 | 58 mph | Stamford mesonet station | High Wind, Southern Fairfield |
| Nov. 30, 2022 | 58 mph | 2 miles west of Stamford | High Wind, Southern Fairfield |
| Feb. 13, 2017 | 57 mph | Near Stamford | High Wind, Southern Fairfield |
| Mar. 22, 2017 | 55 mph | Near Stamford | Strong Wind, Southern Fairfield |
Source: NOAA NCEI Storm Events Database, Southern Fairfield (CTZ009) event narratives.
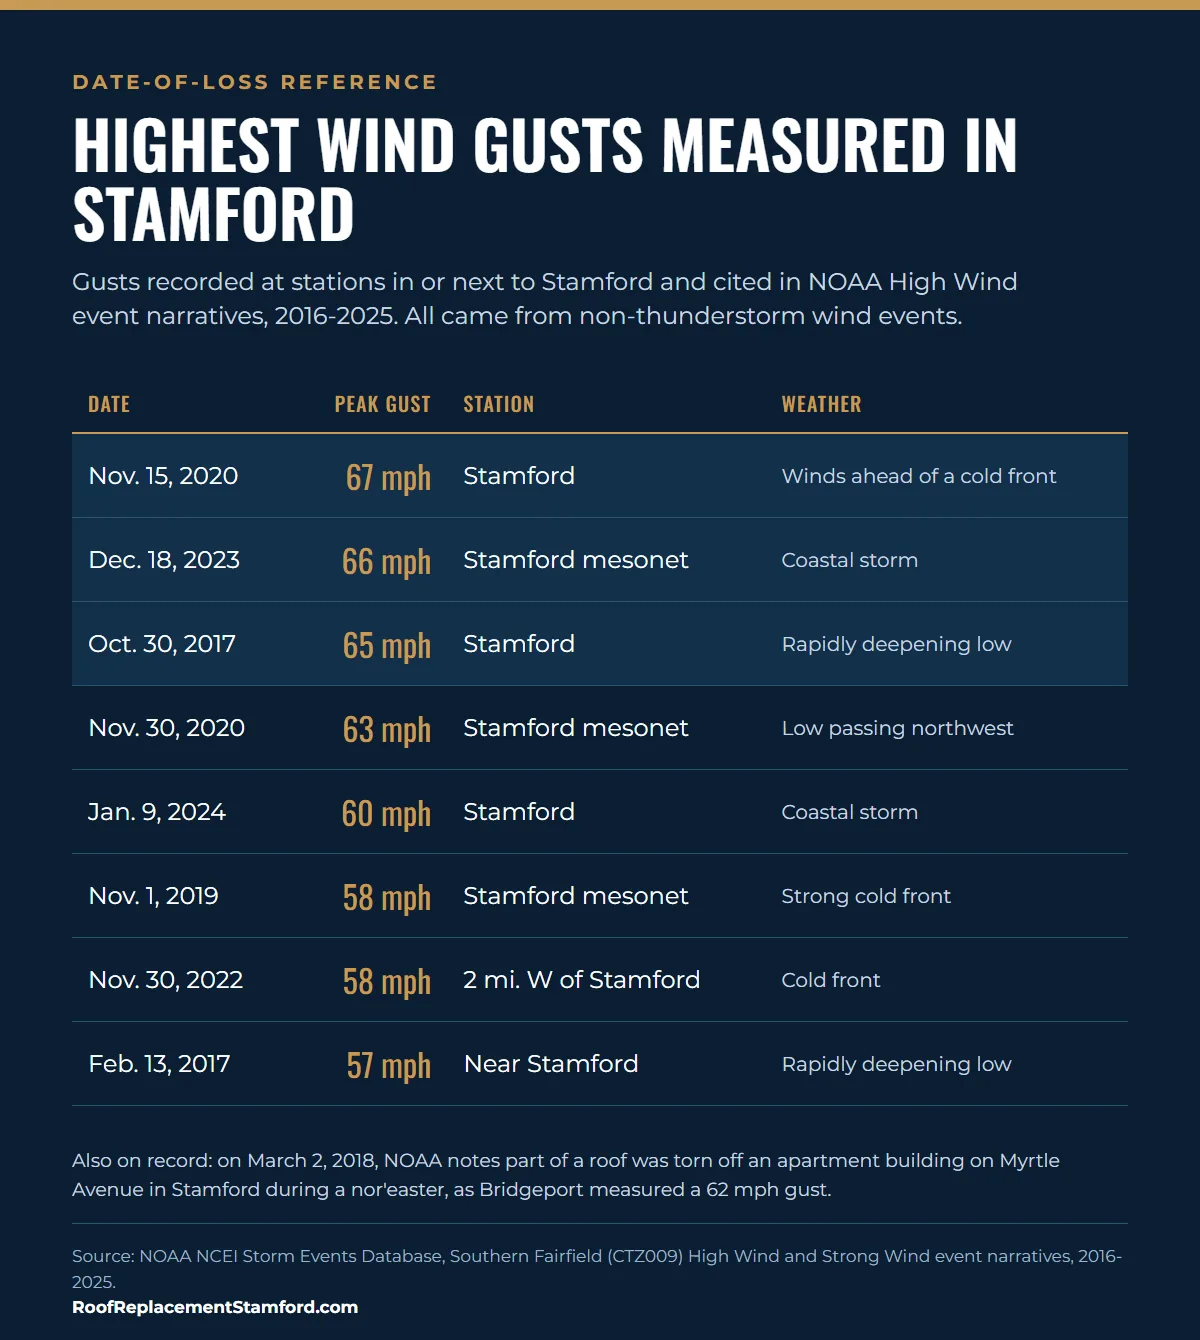
Eight of the nine Stamford-area gust readings above fell between October and February. That lines up with when roofs are most exposed: shingles are stiffer in the cold, and a nor'easter can push wind from the northeast for a day or more. Loose or lifted shingles found after one of these dates are worth photographing before the next storm.
6. Tropical Storms: Isaias, Henri, Elsa and Ida
Only one tropical storm entry appears in NOAA's Fairfield County records for the decade, but it was the most expensive event of all. The other named storms that people remember show up differently, or not at all.
| Storm | Date | What NOAA / FEMA recorded for Fairfield County | Source |
|---|---|---|---|
| Tropical Storm Isaias | Aug. 4, 2020 | Gusts 62 mph at Bridgeport, 68 mph at the Bridgeport tide gauge, 70 mph at Norwalk Light; EF1 tornado in Westport; $18 million property damage across both zones | NOAA |
| Isaias: statewide power outages at peak | Aug. 5, 2020 | 752,225 | NOAA episode narrative |
| Isaias: preliminary Fairfield County public-assistance estimate | 2020 | $8,989,714 | NOAA episode narrative |
| Isaias federal declarations | 2020-2021 | EM-3535 and DR-4580 (public assistance) | FEMA |
| Tropical Storm Elsa | Jul. 9, 2021 | Flash flooding; vehicles stranded throughout Stamford; no tropical storm entry for the county | NOAA |
| Hurricane Henri | Aug. 21-22, 2021 | FEMA emergency declaration EM-3564; no NOAA damage entry for Fairfield County | FEMA |
| Remnants of Hurricane Ida | Sep. 1, 2021 | Flash flooding and water rescues in Stamford; disaster DR-4629 | FEMA |
Henri is the clearest example of why a storm's name is not proof of roof damage. It prompted a federal emergency declaration, but NOAA logged no wind or damage entry for Fairfield County once it passed east. Elsa and Ida were rain events here, recorded as flash floods. Isaias, by contrast, was a wind event, with trees down across the county. If your claim involves a named storm, the NOAA entry for your zone is the record an adjuster is likely to check.
7. Snow, Blizzards and Ice
Winter storms rarely tear roofs off, but heavy wet snow, ice and the ice dams that follow are a steady source of leaks in Stamford. NOAA logged 21 snow and ice storm days in the Fairfield County zones over the decade.
| Date | Event (Southern Fairfield unless noted) | Snow or ice reported | Source |
|---|---|---|---|
| Jan. 23, 2016 | Blizzard / winter storm | 13 to 16 in.; blizzard conditions 3 hours at Bridgeport | NOAA |
| Feb. 9, 2017 | Blizzard / winter storm | 10.3 in. at Bridgeport, 11 in. in Norwalk | NOAA |
| Jan. 4, 2018 | Blizzard / winter storm | 8 to 12 in.; 52 mph gust at Bridgeport | NOAA |
| Mar. 7, 2018 | Winter storm (nor'easter) | 6 to 10 in. | NOAA |
| Feb. 1, 2021 | Winter storm | 15.8 in. at Bridgeport, the largest official Bridgeport total in these entries | NOAA |
| Jan. 28-29, 2022 | Nor'easter | 10.5 in. at Bridgeport; near-blizzard conditions | NOAA |
| Feb. 13, 2024 | Heavy wet snow | 6.2 in. 2 miles north of Stamford | NOAA |
| Feb. 15, 2025 | Ice storm (Northern Fairfield) | 0.48 in. of ice at Danbury Airport | NOAA |
| Dec. 26, 2025 | Heavy snow | 5.9 in. 1 mile west of Stamford | NOAA |
Source: NOAA NCEI Storm Events Database. Winter Storm, Blizzard, Heavy Snow and Ice Storm event days, Northern and Southern Fairfield zones.
Connecticut's building code requires an ice barrier underlayment on every reroof for exactly this reason, as our Stamford roof cost index explains. Our attic heat and ice dam report covers how ventilation and insulation keep snow from melting and refreezing at the eaves, and the winter roof prep page lists what to check before the first nor'easter.
8. Tornadoes and Flooding
Tornadoes are rare in Fairfield County, but two touched down in the decade. Flooding is far more common, though it threatens basements and roads more than roofs.
| Event (2016-2025) | Value | Source |
|---|---|---|
| Tornado, New Canaan to Norwalk, Oct. 2, 2018 | EF1; $50,000 property damage | NOAA |
| Tornado, Westport, Aug. 4, 2020 (waterspout during Isaias) | Roof ripped off a house on Surf Road; NOAA narrative confirms EF1 | NOAA |
| Flash flood entries / days | 89 / 25 | NOAA |
| Property damage NOAA attributed to flash flooding | $5.51 million | NOAA |
| Coastal flood days, Southern Fairfield | 7 (4 in October 2019) | NOAA |
| Federal flood disaster, Aug. 18, 2024 storms | EM-3612 and DR-4820 | FEMA |
Flash flood reports in Stamford itself include Elm Street on April 16, 2018, a stranded school bus with 31 children on Dale Street on September 25, 2018, and water rescues during Elsa and Ida in 2021. Those are not roof events, but heavy rain is when a worn roof, failed flashing or clogged valley shows itself. Our roof leak repair page covers how a leak is traced.
9. Damage Dollars and Disaster Declarations
NOAA attaches a property damage estimate to many entries. These figures are rough (many entries show $0 or nothing at all) and are not insured loss totals, but they show which kinds of storms caused the damage that officials could see.
| Event type (Fairfield County and zones, 2016-2025) | NOAA property damage estimate | Share | Source |
|---|---|---|---|
| Tropical storm (Isaias) | $18,000,000 | 69.0% | NOAA |
| Flash flood | $5,510,000 | 21.1% | NOAA |
| High wind | $1,060,000 | 4.1% | NOAA |
| Strong wind | $780,000 | 3.0% | NOAA |
| Thunderstorm wind | $635,000 | 2.4% | NOAA |
| Tornado | $65,000 | 0.2% | NOAA |
| Lightning | $32,000 | 0.1% | NOAA |
| Hail | $0 | 0% | NOAA |
| Total | $26,082,000 | 100% | Calculated from NOAA |
| Weather-related federal declaration covering Fairfield County | Incident date | Number | Source |
|---|---|---|---|
| Severe storms, tornadoes and straight-line winds | May 15, 2018 | DR-4385 | FEMA |
| Tropical Storm Isaias (emergency, then major disaster) | Aug. 4, 2020 | EM-3535, DR-4580 | FEMA |
| Hurricane Henri (emergency) | Aug. 21, 2021 | EM-3564 | FEMA |
| Remnants of Hurricane Ida | Sep. 1, 2021 | DR-4629 | FEMA |
| Severe storm, flooding, landslides and mudslides | Aug. 18, 2024 | EM-3612, DR-4820 | FEMA |
| Billion-dollar weather disasters affecting Connecticut, 2016-2024 | 16 (of 45 since 1980) | NOAA NCEI | |
| Of those 16: severe storms / tropical cyclones / winter storms / flood / drought | 6 / 4 / 4 / 1 / 1 | NOAA NCEI |
The billion-dollar list is regional: an event counts for Connecticut if it affected the state at all, and the dollar totals cover every state involved. Still, it shows how often Connecticut sits inside a major multi-state loss: 16 events in nine years, nearly two a year. FEMA declarations, by contrast, mostly fund public repairs; Isaias and the May 2018 storms were public-assistance declarations without individual homeowner aid in Fairfield County, so private roof repairs ran through homeowners insurance.
10. Date-of-Loss Timeline for Homeowners and Adjusters
Storm-damage claims hinge on a date. These are the events in NOAA and FEMA records that are most likely to be cited for roof damage in and around Stamford.
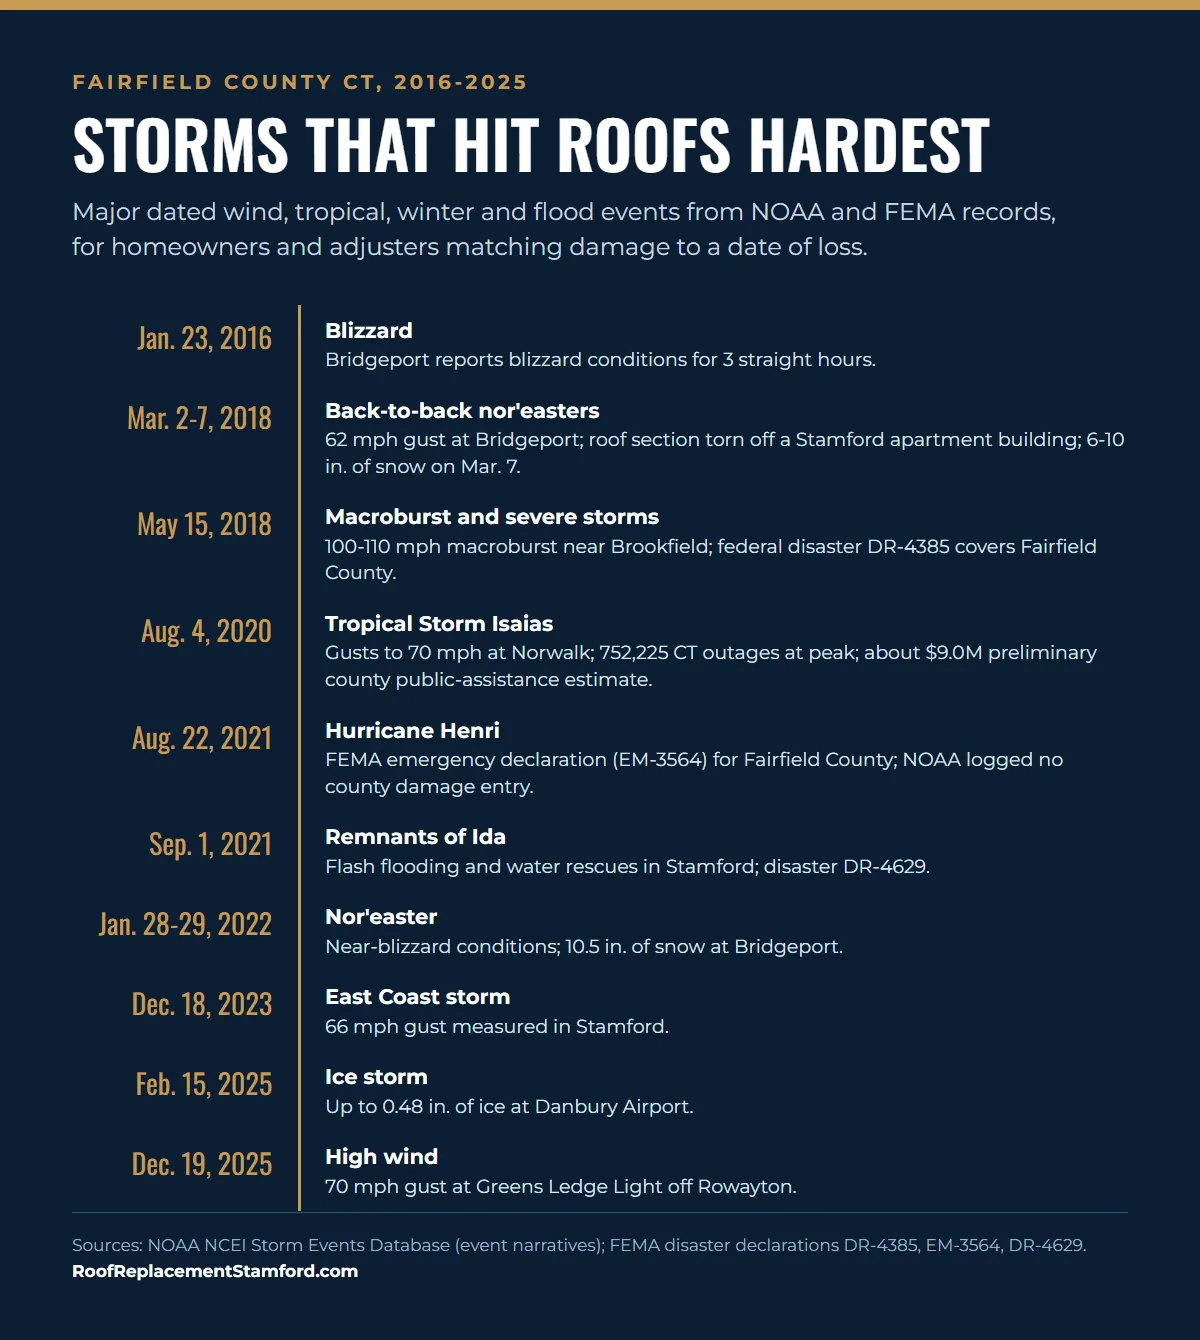
| 2026 so far (NOAA data through early July) | Event | Detail | Source |
|---|---|---|---|
| Jan. 25, 2026 | Winter storm | 15.3 in. at Bridgeport; 10.0 in. 2 miles north-northwest of Stamford | NOAA |
| Feb. 23, 2026 | Blizzard (nor'easter) | 53 mph gust at Bridgeport; 12 to 22 in. of snow in Northern Fairfield | NOAA |
| Jun. 6, 2026 | Thunderstorm wind | Large tree down in a Stamford yard (estimated 63 mph) | NOAA |
| Jun. 11, 2026 | Hail and thunderstorm wind | 1.00-in. hail in Sherman; trees down in Bethel and Fairfield | NOAA |
To check a specific date yourself, open the Storm Events Database, choose Connecticut, then select Fairfield County for hail and thunderstorm wind or the Southern Fairfield zone for high wind, winter and tropical events. NOAA's files lag by several months (the 2026 file currently runs through early July), so very recent storms may not appear yet. Our roof insurance claims page explains how that record fits alongside photos and a contractor's inspection.
11. Storms and Roof Lifespan: What the Research Shows
The brief for this report suggested that storms cut real-world shingle life to 12 to 17 years against 20- to 50-year ratings. We could not find that range in any primary study; it circulates on contractor social media posts without a source, so we do not use it. Here is what published references do say.
| Lifespan statistic | Value | Source |
|---|---|---|
| 3-tab asphalt shingles, estimated life | 20 years | InterNACHI |
| Architectural asphalt shingles, estimated life | 30 years | InterNACHI |
| Asphalt shingles, all types | About 20 years | NAHB study |
| Slate | 100 years | InterNACHI |
| Lifespan aging alone can produce for some roofing products | 10 to 15 years | IBHS |
| Homes older than 5 years with shingle damage at relatively low wind speeds (Gustav and Ike study, 1,412 homes) | More than 40% | IBHS |
| Age at which Connecticut insurers commonly limit eligibility for asphalt roofs | 15 to 20 years | CT Insurance Department |
The IBHS findings come from Gulf Coast hurricanes, not Connecticut, and no study we found measures how much Fairfield County weather shortens a roof's life. What the evidence supports is narrower: shingles lose wind resistance as they age, and frequent wind events like the ones NOAA logs here test that resistance year after year. Our Stamford housing stock and roof age report shows how many local homes are now at or past those lifespans.
12. Roof Condition and Insurer Loss Costs
The brief cited a Verisk finding that roofs in moderate-to-poor condition have 60% higher storm loss costs. Verisk's 2026 U.S. Roof Report release confirms the number with slightly different wording: roofs visibly in moderate-to-poor condition show approximately 60% higher loss costs than roofs in good or excellent condition, based on its Roof Condition Score 2025 baseline data. The release does not limit that figure to storm losses.
| Verisk 2026 U.S. Roof Report finding | Value | Source |
|---|---|---|
| Loss costs, moderate-to-poor vs. good-to-excellent roof condition | About 60% higher | Verisk |
| U.S. homes showing moderate-to-poor roof condition (aerial imagery, 2025) | 38% | Verisk |
| Northeast roofs 31+ years old / 0-4 years old | 18% / 14% | Verisk |
| Average U.S. residential roof replacement claim, 2025 | $17,631 (about 33% above the 2021-2024 average) | Verisk |
| Average U.S. roof repair claim, 2025 | $4,699 (about 25% above the 2021-2024 average) | Verisk |
| Roofing's share of line items in property claim estimates | About 30% | Verisk |
| Change in overall claim volume, 2025 | Nearly 20% lower, while severity rose | Verisk |
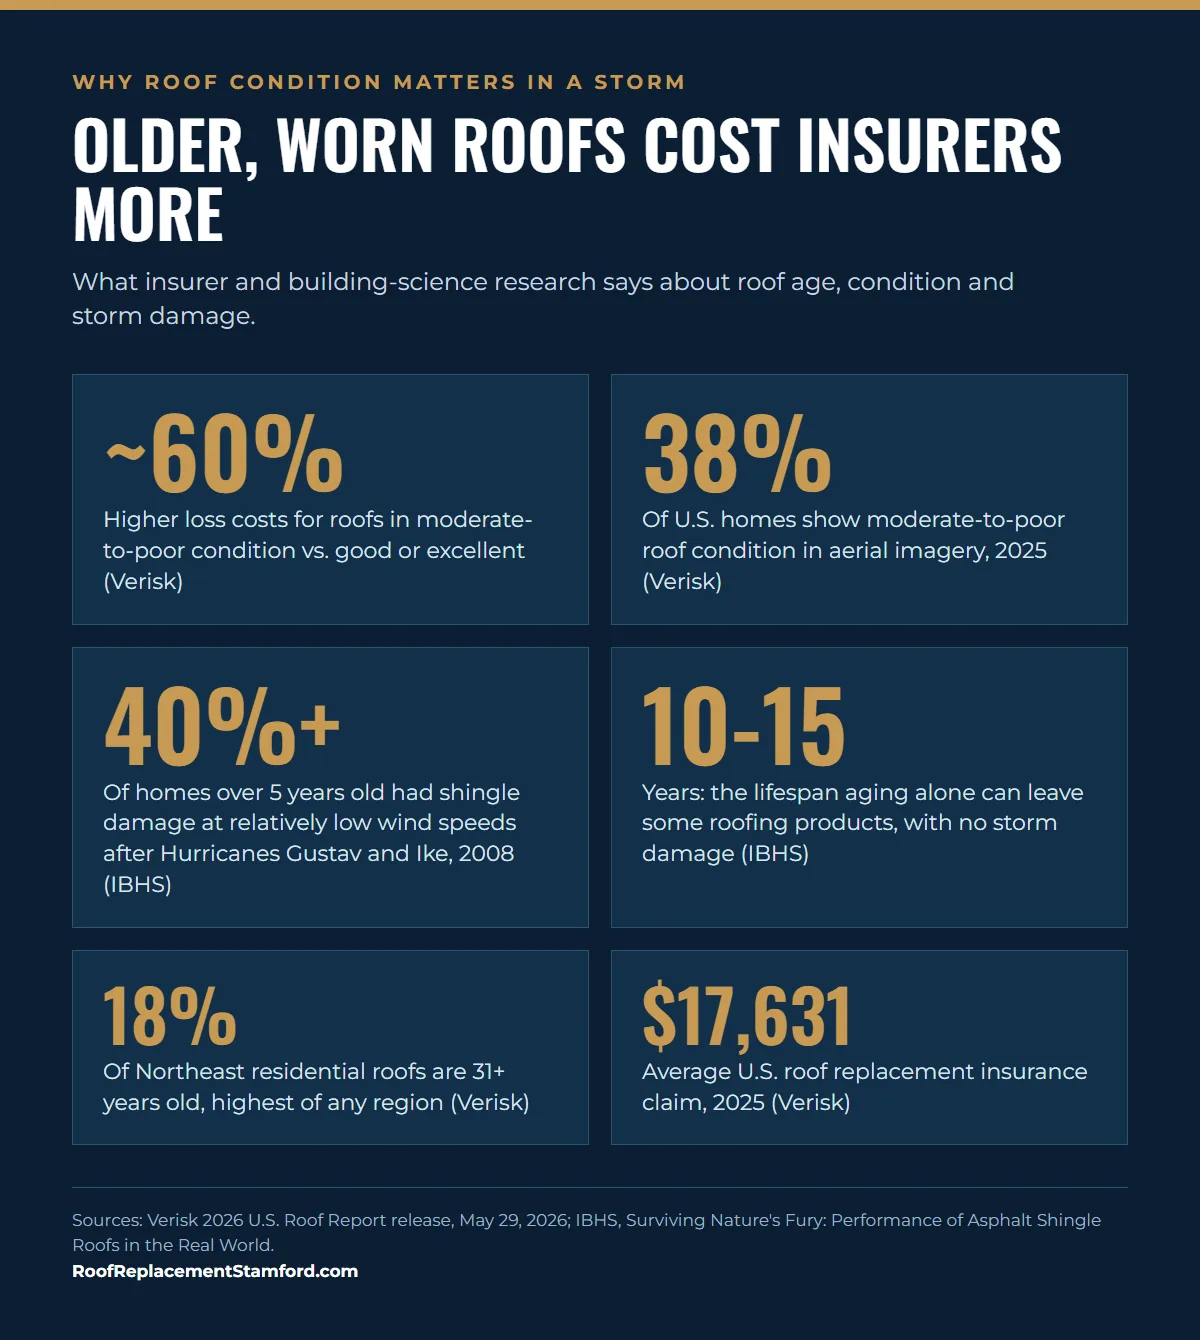
For a Stamford homeowner this is the link between the storm record and an insurance bill. Wind events arrive several times a year here, and a roof in poor condition costs more when they do, which is why insurers look at roof age and condition before renewing. A pre-season roof inspection documents the roof's condition before a storm, which also helps separate new damage from old wear after one.
13. Summary Table: Stamford Hail, Wind and Storm Statistics
| Statistic (Fairfield County, 2016-2025 unless noted) | Value | Source |
|---|---|---|
| All NOAA storm event entries | 416 on 178 days | NOAA Storm Events |
| Severe hail reports (1 in.+) / all hail reports | 5 / 8 | NOAA Storm Events |
| Largest hail | 1.25 in., Newtown, Mar. 15, 2019 | NOAA Storm Events |
| Hail property damage recorded | $0 | NOAA Storm Events |
| Thunderstorm wind reports 60+ mph / days | 129 / 43 | NOAA Storm Events |
| Thunderstorm wind reports measured by instrument | 3 | NOAA Storm Events |
| High wind days (non-thunderstorm) | 24 | NOAA Storm Events |
| Highest gust measured in Stamford | 67 mph, Nov. 15, 2020 | NOAA Storm Events |
| Snow and ice storm days / blizzard days | 21 / 3 | NOAA Storm Events |
| Tropical storm days | 1 (Isaias, Aug. 4, 2020) | NOAA Storm Events |
| Tornadoes | 2 (Oct. 2, 2018; Aug. 4, 2020) | NOAA Storm Events |
| NOAA property damage, all types / Isaias share | $26.1 million / 69% | NOAA Storm Events |
| Weather-related federal declarations covering the county | 7 (5 incidents) | FEMA |
| Billion-dollar disasters affecting CT, 2016-2024 | 16 | NOAA NCEI |
| Loss costs, moderate-to-poor vs. good roofs | About 60% higher | Verisk |
| Northeast roofs 31+ years old | 18% | Verisk |
| Typical asphalt shingle life | 20 (3-tab) to 30 (architectural) years | InterNACHI |
Methodology & Sources
Storm counts come from the NOAA NCEI Storm Events Database yearly detail files (StormEvents_details, versions dated March to October 2026), downloaded November 13, 2026. We kept Connecticut records filed under Fairfield County (county FIPS 09001) or NWS forecast zones CTZ005 (Northern Fairfield) and CTZ009 (Southern Fairfield, which includes Stamford), for events beginning January 1, 2016 through December 31, 2025. The equivalent search in NOAA's online tool is State: Connecticut; County: Fairfield; date range 01/01/2016 to 12/31/2025; event types Hail (1.00 in. and larger) and Thunderstorm Wind (52 kt and stronger), plus the two Fairfield zones for High Wind, Winter Storm, Blizzard, Heavy Snow, Ice Storm and Tropical Storm. "Days" are distinct begin dates per event type. NOAA files Connecticut events under the pre-2022 counties and forecast zones, not the Census planning regions, so no adjustment was needed. Damage dollars are NOAA's own estimates and are not insured losses. Stamford gust readings are quoted from NOAA event narratives. FEMA declarations come from the OpenFEMA disaster declarations dataset; billion-dollar events from NCEI's Connecticut event list, which runs through 2024. Brief figures checked: the "12 to 17 year" storm-shortened lifespan could not be traced to a primary source and was replaced with InterNACHI, NAHB and IBHS figures; the Verisk "60% higher loss costs" finding was confirmed, with the wording corrected from "storm loss costs" to "loss costs." This site connects callers with an independent local roofing contractor and does not adjust or settle claims.
- NOAA NCEI Storm Events Database
- NOAA Storm Events bulk CSV files, 2016-2026
- NWS Instruction 10-1605, Storm Data Preparation (2021)
- National Weather Service, Severe Thunderstorm Safety
- NOAA NCEI, Billion-Dollar Disasters: Connecticut
- FEMA DR-4385, May 2018 storms
- FEMA DR-4580, Tropical Storm Isaias
- FEMA EM-3564, Hurricane Henri
- FEMA DR-4629, Remnants of Ida
- FEMA DR-4820, August 2024 flooding
- Federal Register, Change to County-Equivalents in Connecticut (2022)
- Census Bureau ACS user note 2023-01
- Verisk, 2026 U.S. Roof Report release
- IBHS, Performance of Asphalt Shingle Roofs in the Real World
- InterNACHI Estimated Life Expectancy Chart
- NAHB Study of Life Expectancy of Home Components
- CT Insurance Department consumer advisory, Feb. 2026
- Angi, Roof Repair Cost (2026)
14. Frequently Asked Questions
How often does it hail in Stamford, CT?
Rarely, by NOAA's records. From 2016 through 2025 the NOAA Storm Events Database logged 8 hail reports of 0.75 inch or larger in all of Fairfield County, and only 5 of severe size (1 inch or larger), on 5 separate days. None was located in Stamford; the largest was 1.25-inch hail in Newtown on March 15, 2019. Seven of the ten years had no severe hail report, and NOAA recorded no hail property damage in the county.
Is wind or hail the bigger roof risk in Stamford?
Wind, by a wide margin. In the same ten years NOAA logged 129 thunderstorm wind reports of 60 mph or more on 43 days in Fairfield County, plus 24 days of non-thunderstorm high wind from nor'easters and strong fronts, against 5 severe hail reports. Measured gusts in Stamford reached 67 mph on November 15, 2020, 66 mph on December 18, 2023 and 65 mph on October 30, 2017.
How do I find the date of a storm for a roof insurance claim?
Search the NOAA NCEI Storm Events Database for Connecticut. Hail, thunderstorm wind, tornado and flash flood events are filed under Fairfield County; high wind, winter storm, blizzard and tropical storm events are filed under the forecast zones Southern Fairfield (which includes Stamford) and Northern Fairfield. Each event lists the date, time, magnitude and a narrative of reported damage that you or your adjuster can match to the damage on your roof.
Does NOAA use Connecticut's new planning regions for storm data?
No. The Census Bureau replaced Connecticut's eight counties with nine planning regions as county-equivalents in 2022, but NOAA's Storm Events files through mid-2026 still file Connecticut events under the old counties, including Fairfield County (FIPS 09001), and under the NWS forecast zones. FEMA's disaster declarations also still list Fairfield County.
How long does a roof last in Connecticut?
Reference charts put 3-tab asphalt shingles at about 20 years and architectural shingles at about 30 (InterNACHI), and asphalt shingles generally at about 20 years (NAHB). IBHS research notes that aging alone can cut some roofing products' lifespan to 10 to 15 years, and Connecticut insurers commonly start limiting eligibility for asphalt roofs at 15 to 20 years. We found no primary study that measures a Connecticut-specific storm-shortened lifespan.
What was the worst storm for roofs in Fairfield County in the last ten years?
By NOAA's damage estimates, Tropical Storm Isaias on August 4, 2020: gusts reached 70 mph at Norwalk and 62 mph at Bridgeport, Connecticut outages peaked at 752,225, and NOAA listed $18 million in property damage across the county's two forecast zones. The most intense wind was the May 15, 2018 macroburst near Brookfield, with winds estimated at 100 to 110 mph, which led to federal disaster declaration DR-4385.
Keep Reading
Storm Damage on a Stamford Roof?
Talk to an independent local roofing contractor about an inspection after wind, snow or ice, and what to document for your insurer. Calls are connected 8 a.m. to 9 p.m.
Call +1 203-691-4756 More ways to reach us